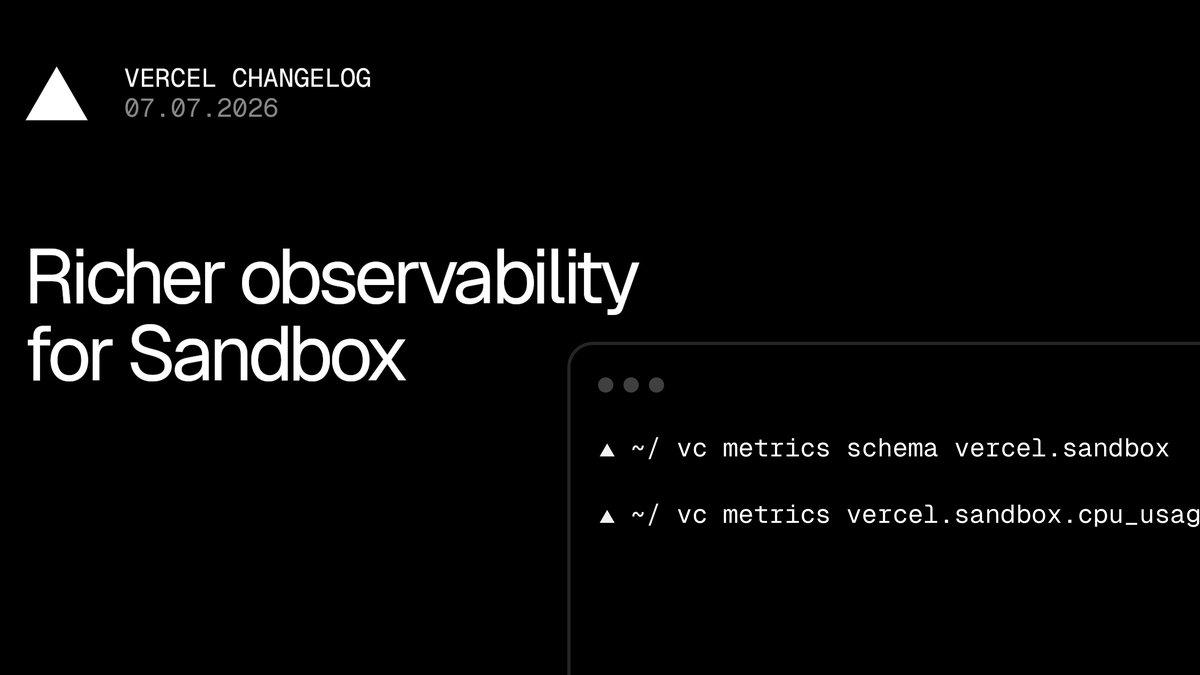
Vercel Sandbox observability now includes detailed resource metrics, giving you deeper visibility into how your sandboxes consume compute and networking.
From the Observability tab in your dashboard, you can now monitor:
Active CPU and CPU usage: Measures when your code actively uses the CPU. Active CPU is measured in core-hours and time spent waiting on I/O, such as network requests or model call...